Investigating The Beatles with Machine Learning
During my sophomore year in college, I enrolled in a class titled ‘Music of the Beatles’, which was taught by the legendary Glenn Gass. Glenn spent over 40 years teaching at Indiana University and famously developed the first history of rock and roll course at a major university. The course was taught late in the evening on Tuesdays and Thursdays and took place in an old lecture hall at the center of campus, where Glenn would spend almost two hours walking us through the history of the Beatles. We listened to every album from that era, absorbing the stories and inspirations behind every song, and appreciating their unique brilliance.
It seems counterintuitive to use something as emotionless as machine learning to rank the emotional range of a piece of music. And it’s not necessarily wrong to have a negative reaction to the idea — Some people on Reddit certainly did. I posted one of the charts from this analysis to subreddits like r/Beatles and it generated some mixed reactions. ‘Anxious-Raspberry-54’ said, “I could care less about a computer analyzing songs. It’s art”, while ’Clutch-Cargo52 said, “Energy comes from the heart and the core of a person, not fingers and throats…and especially not from a computer program.” And you know what? They’re right! But I think this analysis is interesting, in part, because it does actually account for many of that things that tend to correlate with our feelings for a song. In other words, this is an attempt to measure song characteristics (yes, with the help of computers) as a human might perceive them. This obviously requires a robust and validated model with multiple different data points to successfully execute. Thankfully, that’s precisely what Spotify’s developer team has created (with some help). I’ll start with an example that shows that in action.
Overview of The Beatles Discography
One of the audio attributes measured by Spotify is “Energy”, which is meant to represent the overall intensity and activity of a song. Their Developer Documentation says, “Typically, energetic tracks feel fast, loud, and noisy. For example, death metal has high energy, while a Bach prelude scores low on the scale. Perceptual features contributing to this attribute include dynamic range, perceived loudness, timbre, onset range, and general entropy”. Of course, this does not consider the song’s origin, specific lyrics, or other attributes that could contribute to the energy one feels while listening to a song. That said, it does contain some key attributes that highly correlate to perceive energy from listeners. The chart below breaks down the energy characteristics of every album in their discography (minus Magical Mystery Tour and Yellow Submarine). It contains some interesting findings.
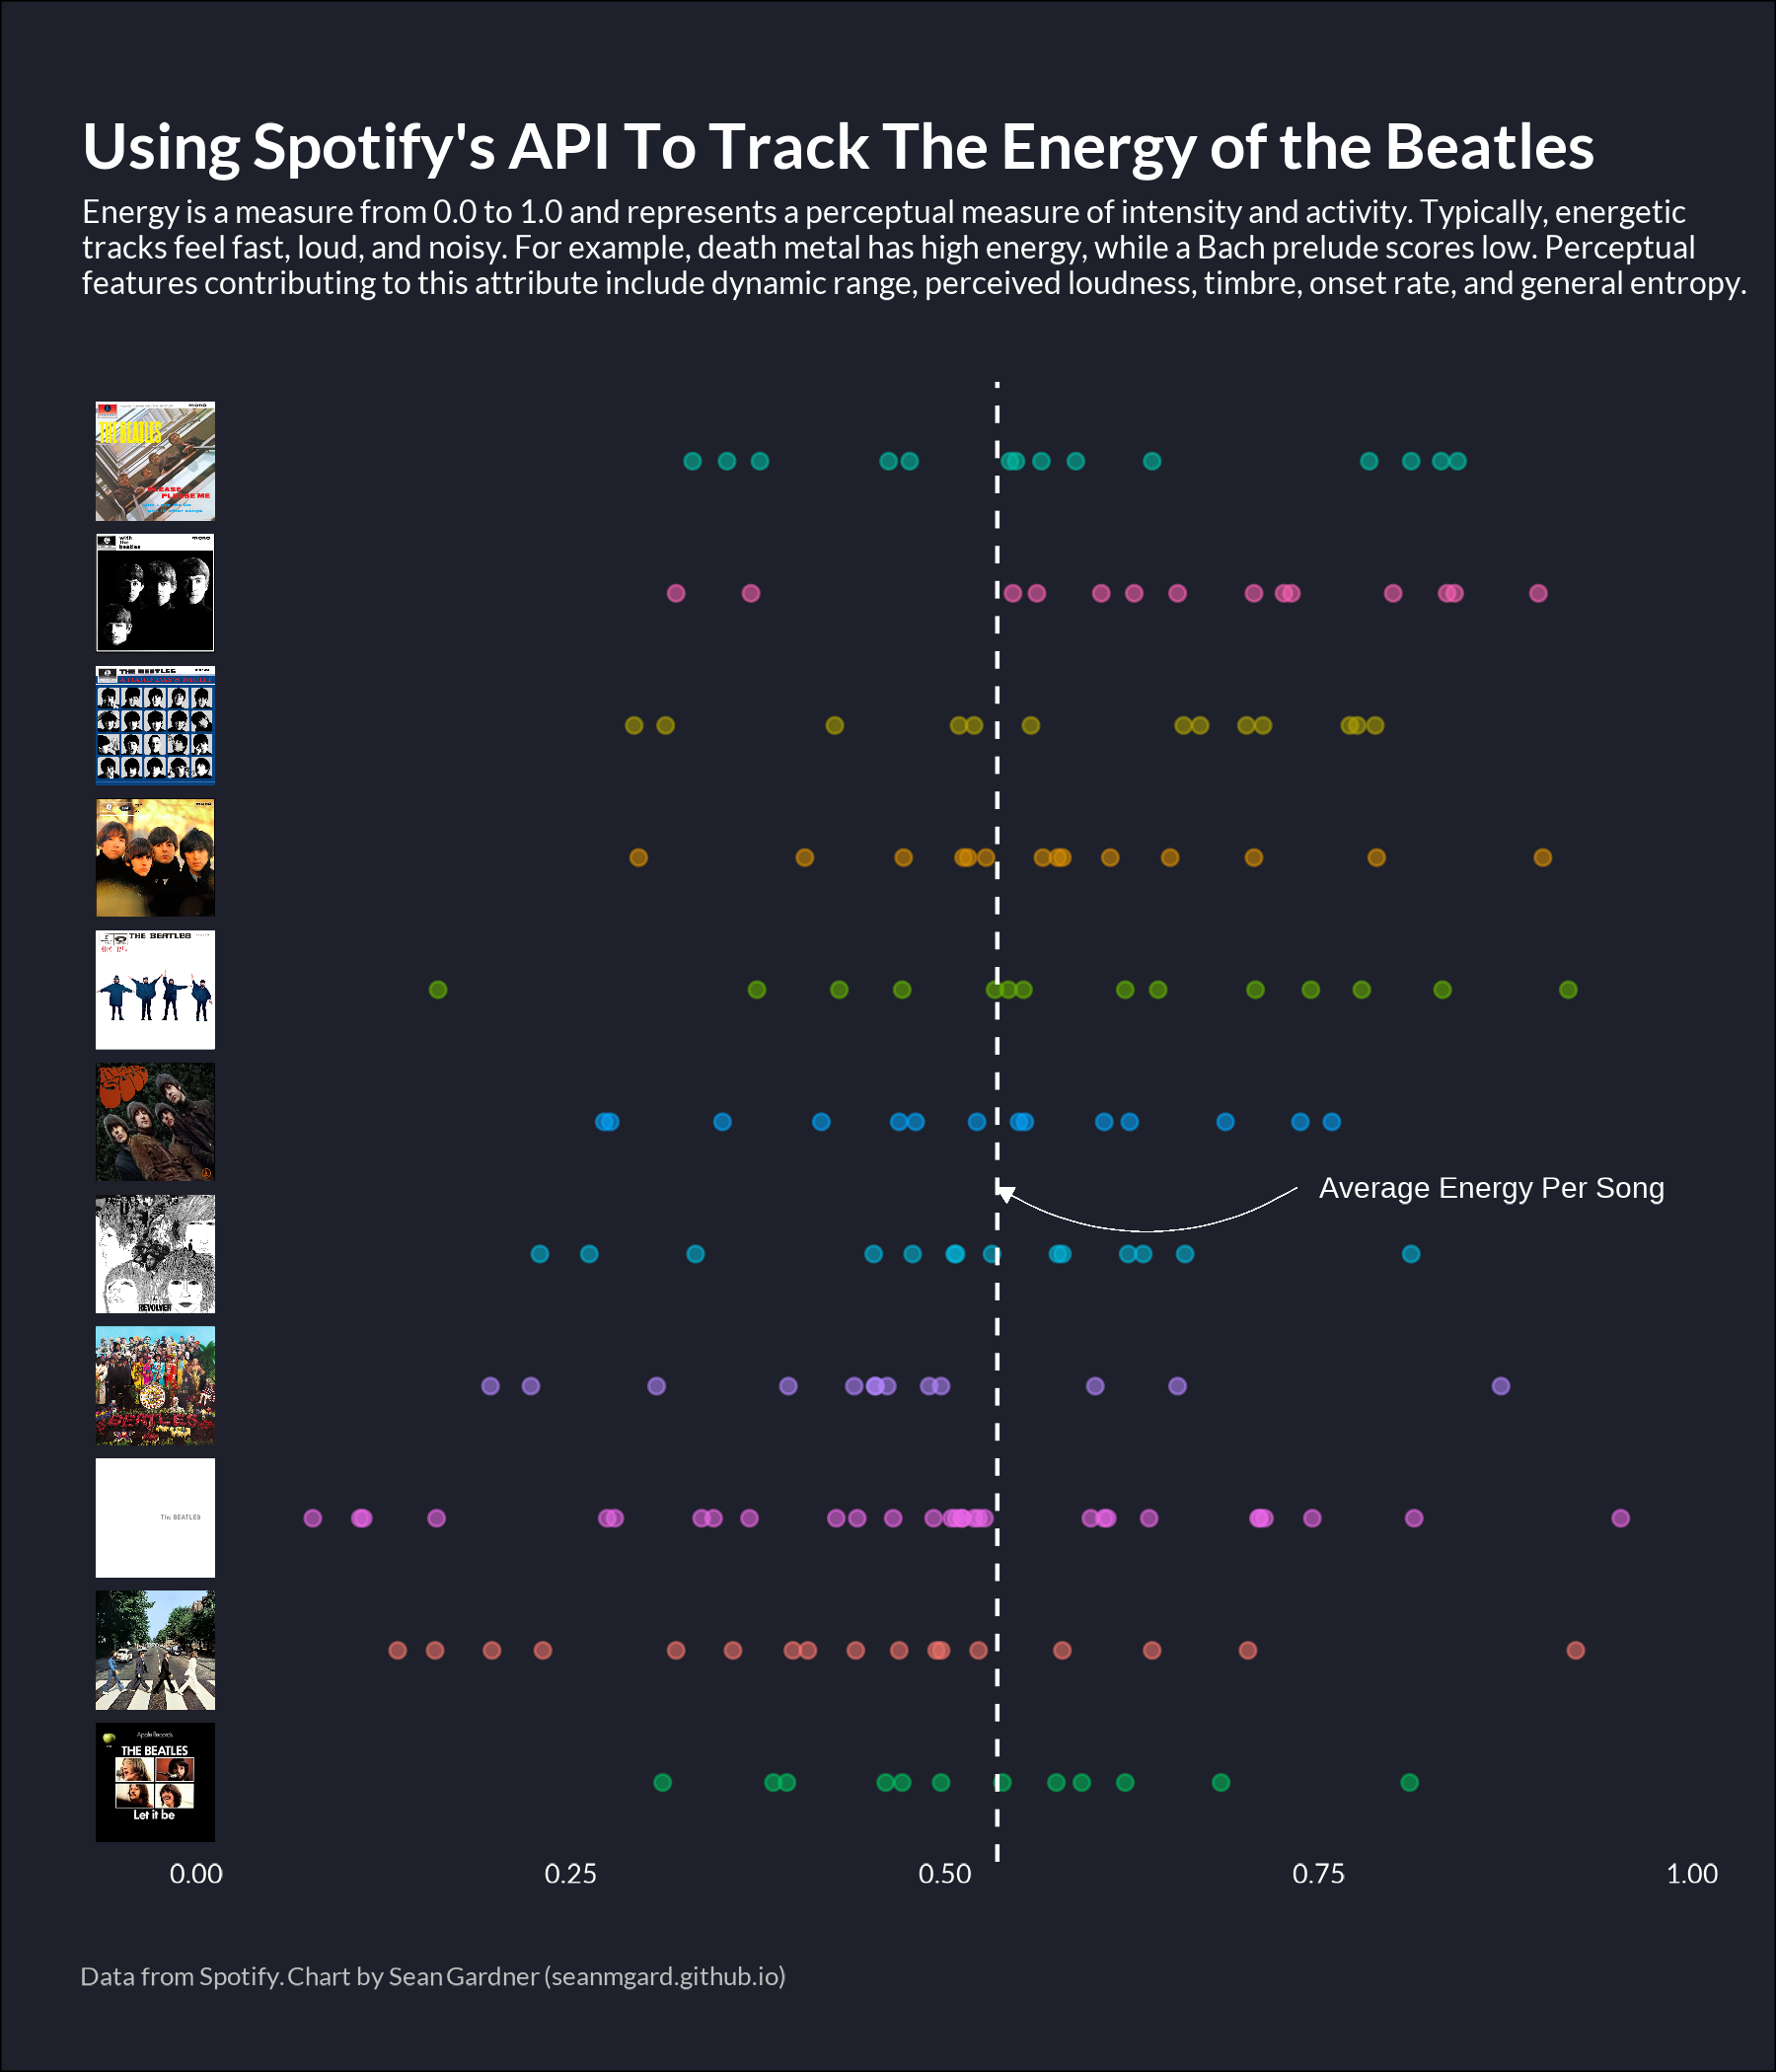
On average, the Beatles displayed far more energy earlier in their career. In fact, their first five studio releases represent the five most energetic albums of their entire discography – Though their second album, With The Beatles, is meaningfully more energetic than numbers two through five. This is likely not surprising when you listen to tracks like I Wanna Be Your Man, Little Child, and Money (That’s What I Want), all of which fall in the top 10 of the entire Beatles catalog of 200+ songs.
Though later albums display less energy on average, that doesn’t necessarily mean the band could no longer bring it. The two most energetic tracks ever released by the Beatles were ‘Back In The U.S.S.R’ and ‘Polythene Pam’, which were on the White Album and Abbey Road respectively. This more reflects the range present as the band became more mature, a dynamic that becomes clear from the chart above. The points are far more sporadic on something like the White Album, which included low-energy tracks like Julia and Blackbird alongside high-energy tracks like Helter Skelter.
Breaking Down the Songs
The range of the Beatles is evident from the first chart. The plot below highlights that range in more detail. The first table ranks the albums by overall energy, while the second and third tables show the highest and lowest ranking songs by energy on each album.
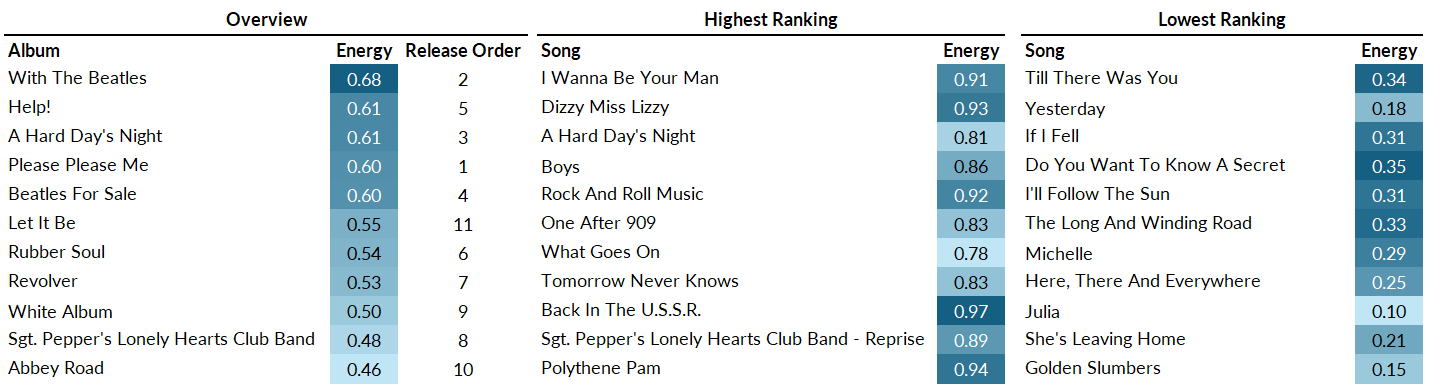
These dynamics also break down in interesting ways across each member of the band. Lennon and McCarthy composed over 80% of the Beatles catalog, either in an individual capacity or through collaboration. Paul arguably displays more energetic range throughout his contributions, but overall, ranked the lowest out of all four Beatles. Combined Lennon/McCarthy tracks displayed the highest energy by a meaningful margin, led by songs like ‘Little Child’ and ‘I Wanna Be Your Man’. George’s contributions tended to congregate more towards the middle in terms of ‘energy’, as did Ringo, though his his role as a ‘composer’ was minimal – But I did love ‘Octopus’s Garden’.

Are Any of These Measures Correlated?
Spotify doesn’t just track Energy – Their team calculates various audio features for tens of millions of different songs. These audio features include a wide range of metrics that can be used to measure a song’s structure and musical content.
Energy
Energy is a measure from 0.0 to 1.0 and represents a perceptual measure of intensity and activity. Typically, energetic tracks feel fast, loud, and noisy. For example, death metal has high energy, while a Bach prelude scores low on the scale. Perceptual features contributing to this attribute include dynamic range, perceived loudness, timbre, onset rate, and general entropy.
Danceability
Danceability describes how suitable a track is for dancing based on a combination of musical elements including tempo, rhythm stability, beat strength, and overall regularity. A value of 0.0 is least danceable and 1.0 is most danceable.
Instrumentalness
Predicts whether a track contains no vocals. “Ooh” and “aah” sounds are treated as instrumental in this context. Rap or spoken word tracks are clearly “vocal”. The closer the instrumentalness value is to 1.0, the greater likelihood the track contains no vocal content. Values above 0.5 are intended to represent instrumental tracks, but confidence is higher as the value approaches 1.0.
Loudness
The overall loudness of a track in decibels (dB). Loudness values are averaged across the entire track and are useful for comparing relative loudness of tracks. Loudness is the quality of a sound that is the primary psychological correlate of physical strength (amplitude). Values typically range between -60 and 0 db.
Speechiness
Speechiness detects the presence of spoken words in a track. The more exclusively speech-like the recording (e.g. talk show, audio book, poetry), the closer to 1.0 the attribute value. Values above 0.66 describe tracks that are probably made entirely of spoken words. Values between 0.33 and 0.66 describe tracks that may contain both music and speech, either in sections or layered, including such cases as rap music. Values below 0.33 most likely represent music and other non-speech-like tracks.
Tempo
The overall estimated tempo of a track in beats per minute (BPM). In musical terminology, tempo is the speed or pace of a given piece and derives directly from the average beat duration.
Valence
A measure from 0.0 to 1.0 describing the musical positiveness conveyed by a track. Tracks with high valence sound more positive (e.g. happy, cheerful, euphoric), while tracks with low valence sound more negative (e.g. sad, depressed, angry).
These features contain unique information about songs, but also share common characteristics in certain cases. The chart below shows how some of these measures correlate with energy for songs in the Beatles discography.
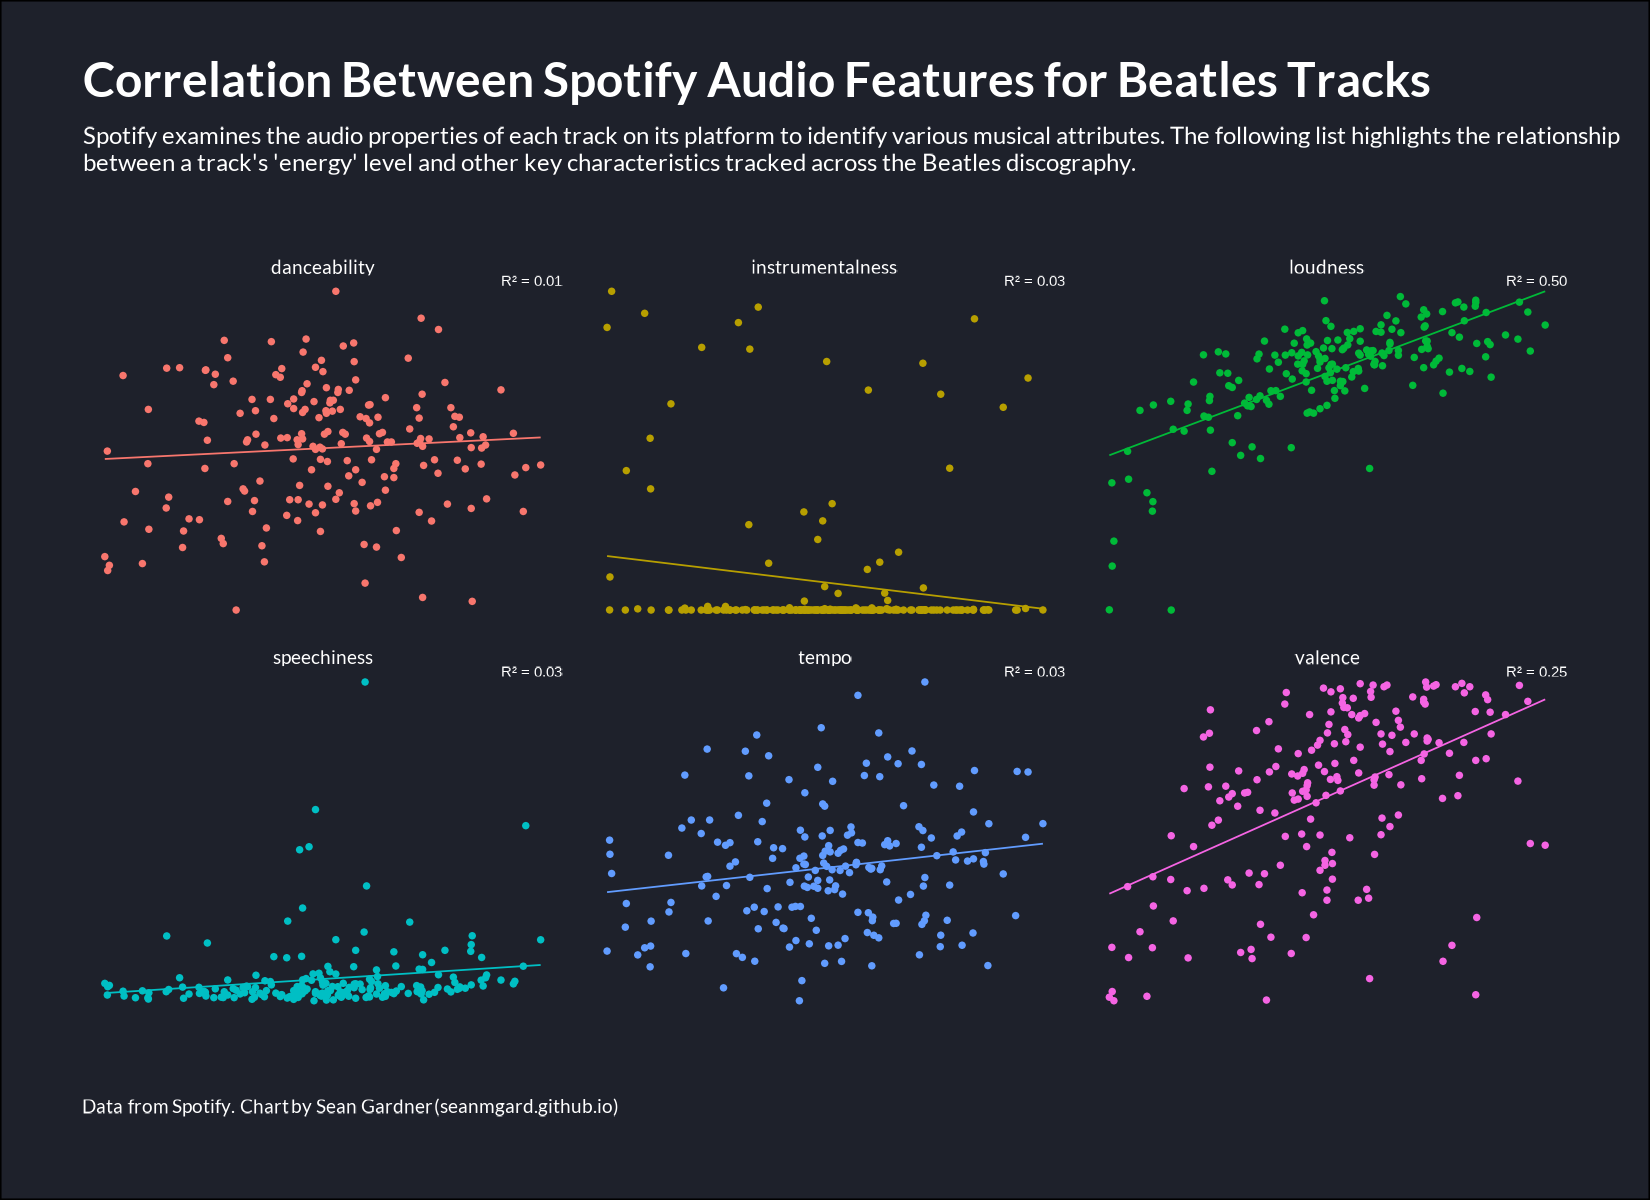
In general, most audio features show little correlation with energy for Beatles songs. As the Spotify description notes, energetic tracks tend to be associated with things like perceived loudness or intensity, which perhaps explains why ‘loudness’ and ‘valence’ were the two metrics most correlated with energy. With valence, we observe an R-Squared of 0.25, while loudness is 0.50. That said, the observations across all measures are clearly sporadic.
What Goes Into a Rating?
In 2014, Spotify acquired ‘The Echo Nest’ in a $100M deal that provided it with new audio tracking capabilities. The core methodology used to calculate Spotify’s ‘Audio Features’ originated with this acquisition. Interestingly, the concepts leveraged by Echo Nest originated even earlier with a dissertation from Tristan Jehan titled, ‘Creating Music by Listening’, which was published in 2005. The entire thesis can be found here, but a brief overview of the Abstract can be found below
Machines have the power and potential to make expressive music on their own. This thesis aims to computationally model the process of creating music using experience from listening tot examples. Our unbiased signal-based solution models the life cycle of listening, composing, and performing, turning the machine into an active musician, instead of simply an instrument. We accomplish this through an analysis-synthesis technique by combined perceptual and structural modeling of the musical surface, which leads to a minimal data representation.
We introduce a music cognition framework that results from the interaction of psychoacoustically grounded casual listening, a time-lag embedded feature representation, and perceptual similarity clustering. Out bottom-up analysis intends to be generic and uniform by recursively revealing metrical hierarchies and structures of pitch, rhythm, and timbre. Training is suggested for top-down unbiased supervision, and is demonstrated with the prediction of downbeat. This musical intelligence enables a range of original manipulations including song alignment, music restoration, cross-synthesis or song morphing, and ultimately the synthesis of original pieces.
While the algorithms used have become more complex over time, the core principles outlined by Jehan are still a core part of those calculations. Spotify’s documentation unfortunately does not break down how each of the current metrics are precisely calculated. Your best bet for understanding those calculations would be Jehan’s original paper. Fortunately, there are still some sporadic examples across the web that dive into these calculations a bit deeper than the primary documentation.
For example, we have some information about the probability distributions of these metrics. The features are not normally distributed and some like instrumentalness, acousticness, and speechiness display a significant right skew. Mark Koh, an Engineer at Spotify, outlined some of this in a presentation given at the Monthly Music Hackathon NYC in 2018. The distribution breakdowns can be found in the chart below.
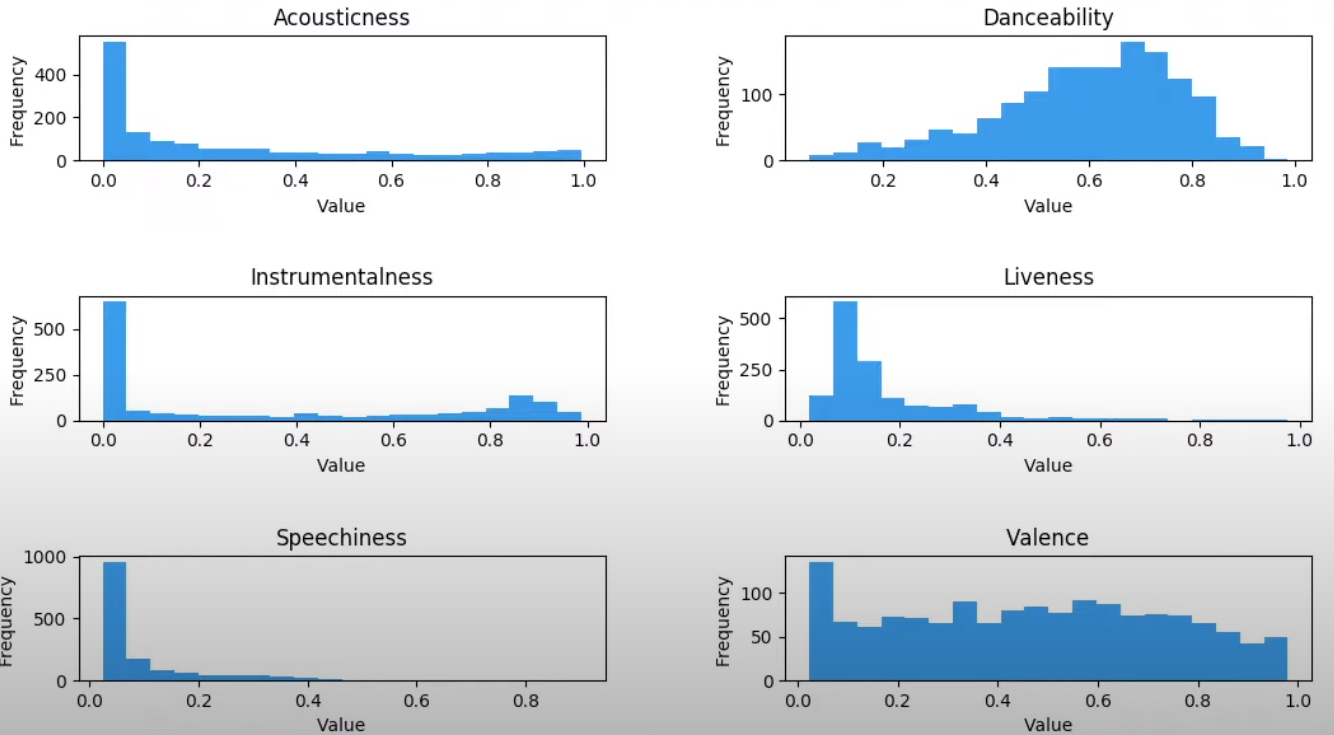
Mark’s presentation goes into a lot more detail on some of these metrics (which, as a non-musician, is a bit beyond my level of understanding). You can view more from that presentation here.
Summary
This is not meant to be an objective ranking of the quality of the Beatles catalog. Their discography inspires all sorts of emotions in listeners, and the relative quality (or any metric for that matter) is in the eye of the beholder. Nonetheless, it’s interesting to see the ways researchers are able to quantify and measure certain attributes of songs, even from bands as iconic as the Beatles. This approach goes beyond traditional subjective interpretation and offers new insights into the construction and impact of different songs. While it doesn’t diminish the personal and emotional connections that fans have with the music, it adds a layer of appreciation for the craftsmanship and innovation that goes into creating these tracks. More than anything, I think it helps quantify many of the lessons Glenn taught me in his class years ago.