A Review of Employment Data (March 2023)
On March 9th, the Bureau of Labor Statistics (BLS) released its Job Openings and Labor Turnover report (also known as “JOLTS”) for January 2023. The report noted a slight decline in the number of job openings for the month, largely driven by construction, accommodation and food services, and finance and insurance.
The following day, we received the Employment Situation, which showed that non-farm payroll rose by 311,000 for the month of February, with the unemployment rate (3.6%) and unemployed persons (5.9 million) rising as more people entered the labor force. This comes alongside a plethora of other reports, along with commentary from market analysts, who are trying to project where the employment situation might go.
We live in an interesting era, where traditional employment tells conflicting stories. That data can even be bolstered, or contradicted, by ongoing data released from companies like LinkedIn and Indeed. While data from those sites may paint a less comprehensive picture, it still provides helpful insight on the overall macroeconomic situation. It also causes confusion when there are gaps in methodologies, timing, and economic metrics that tell varying stories.
What does the data show?
First, let’s look at some of the employment metrics. I’ve broken the data based on the various reports and tried to tie the threads together where applicable. Let’s start with the ADP Employment Report.
At a national level, ADP nonfarm payrolls rose by 242,000, beating estimates of 200,000. That said, as Pantheon Macro noted on Wednesday, ADP developed a new methodology for their employment calculations in August of 2022, and has only released 6 payroll numbers since then. Of those, four have undershot official payrolls. We still don’t know whether that trend will hold, of course, but it’s important to remember these estimates can be inconsistent.
Further data from the report shows a more nuanced picture.
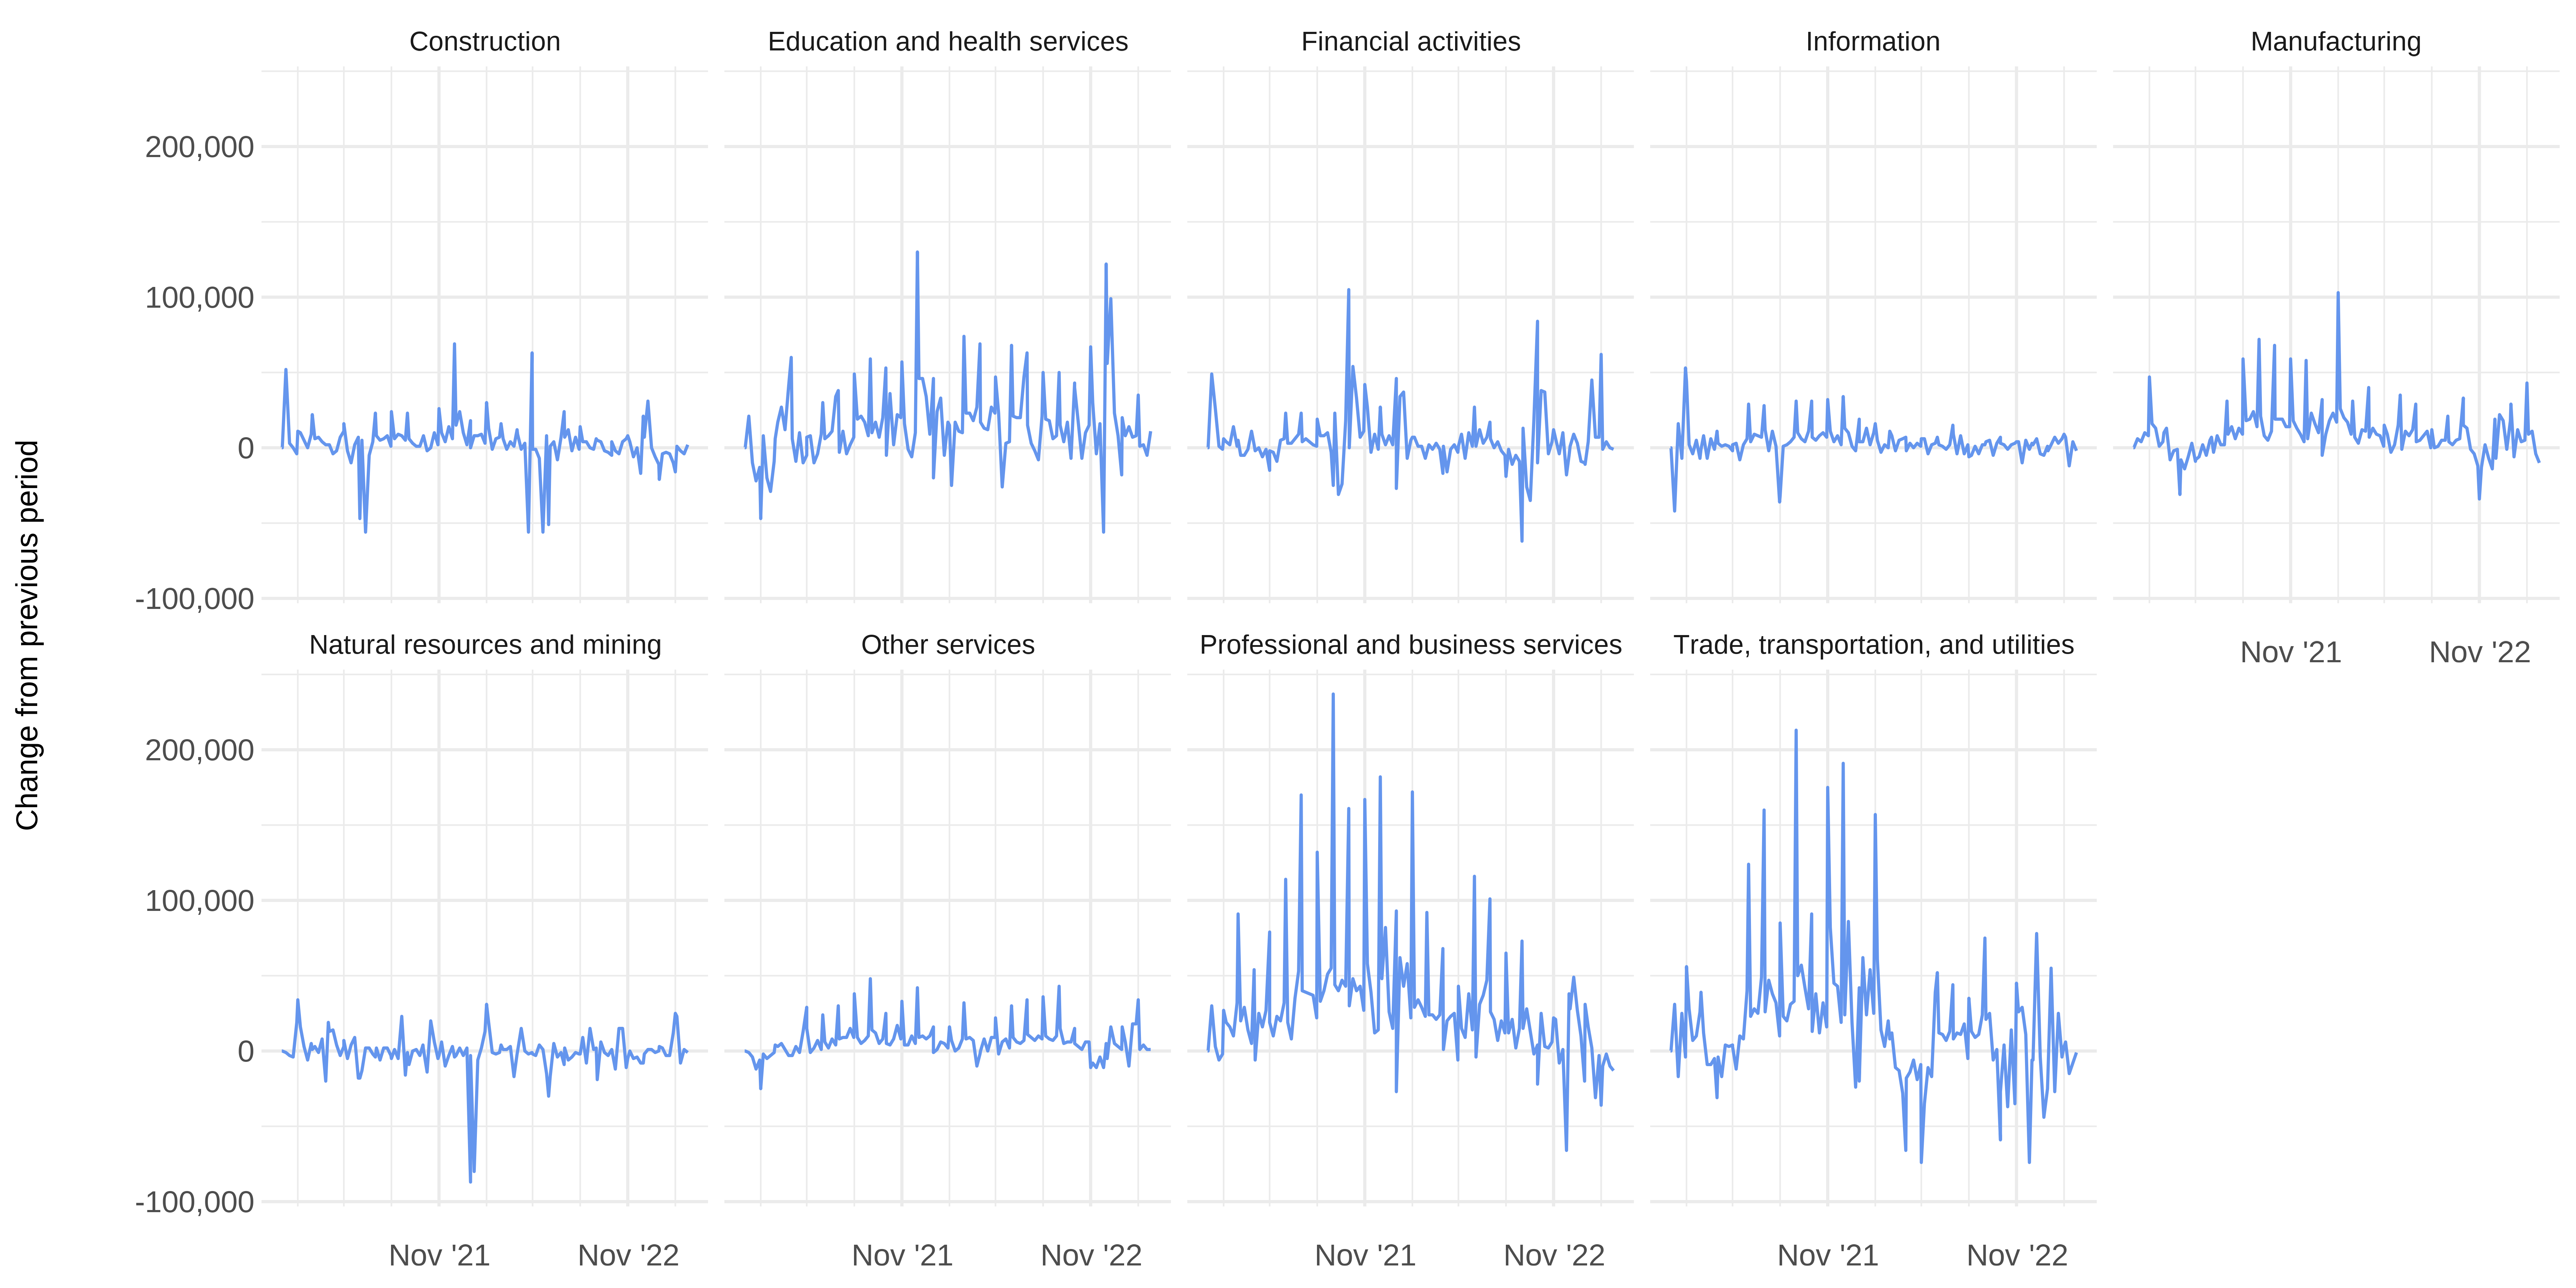
The chart above shows the week-to-week change in private employment by industry since mid-2021. In the month of February, job growth was led, in part, by growth in financial activities (+62,000) and manufacturing (+43,000). Not shown in the chart above is Leisure and Hospitality, which also showed job growth of +83,000 as well. Beyond that, education and health services (+35,000), natural resources and mining (+25,000), and other services (+34,000) showed growth. Declines were observed in professional and business services (-36,000) and construction (-16,000). Net- Overall employment seems to be positive, though there is some underlying weakness below the surface. This becomes clearer if we break the report down by size of business.
Positive trends were driven entirely by businesses with more than 50+ employees. Small businesses (those with 19 or less employees) saw employment contract by -56,000 in the month of February. On the opposite end of the spectrum, employment by businesses larger than 500 employees grew by +160,000.
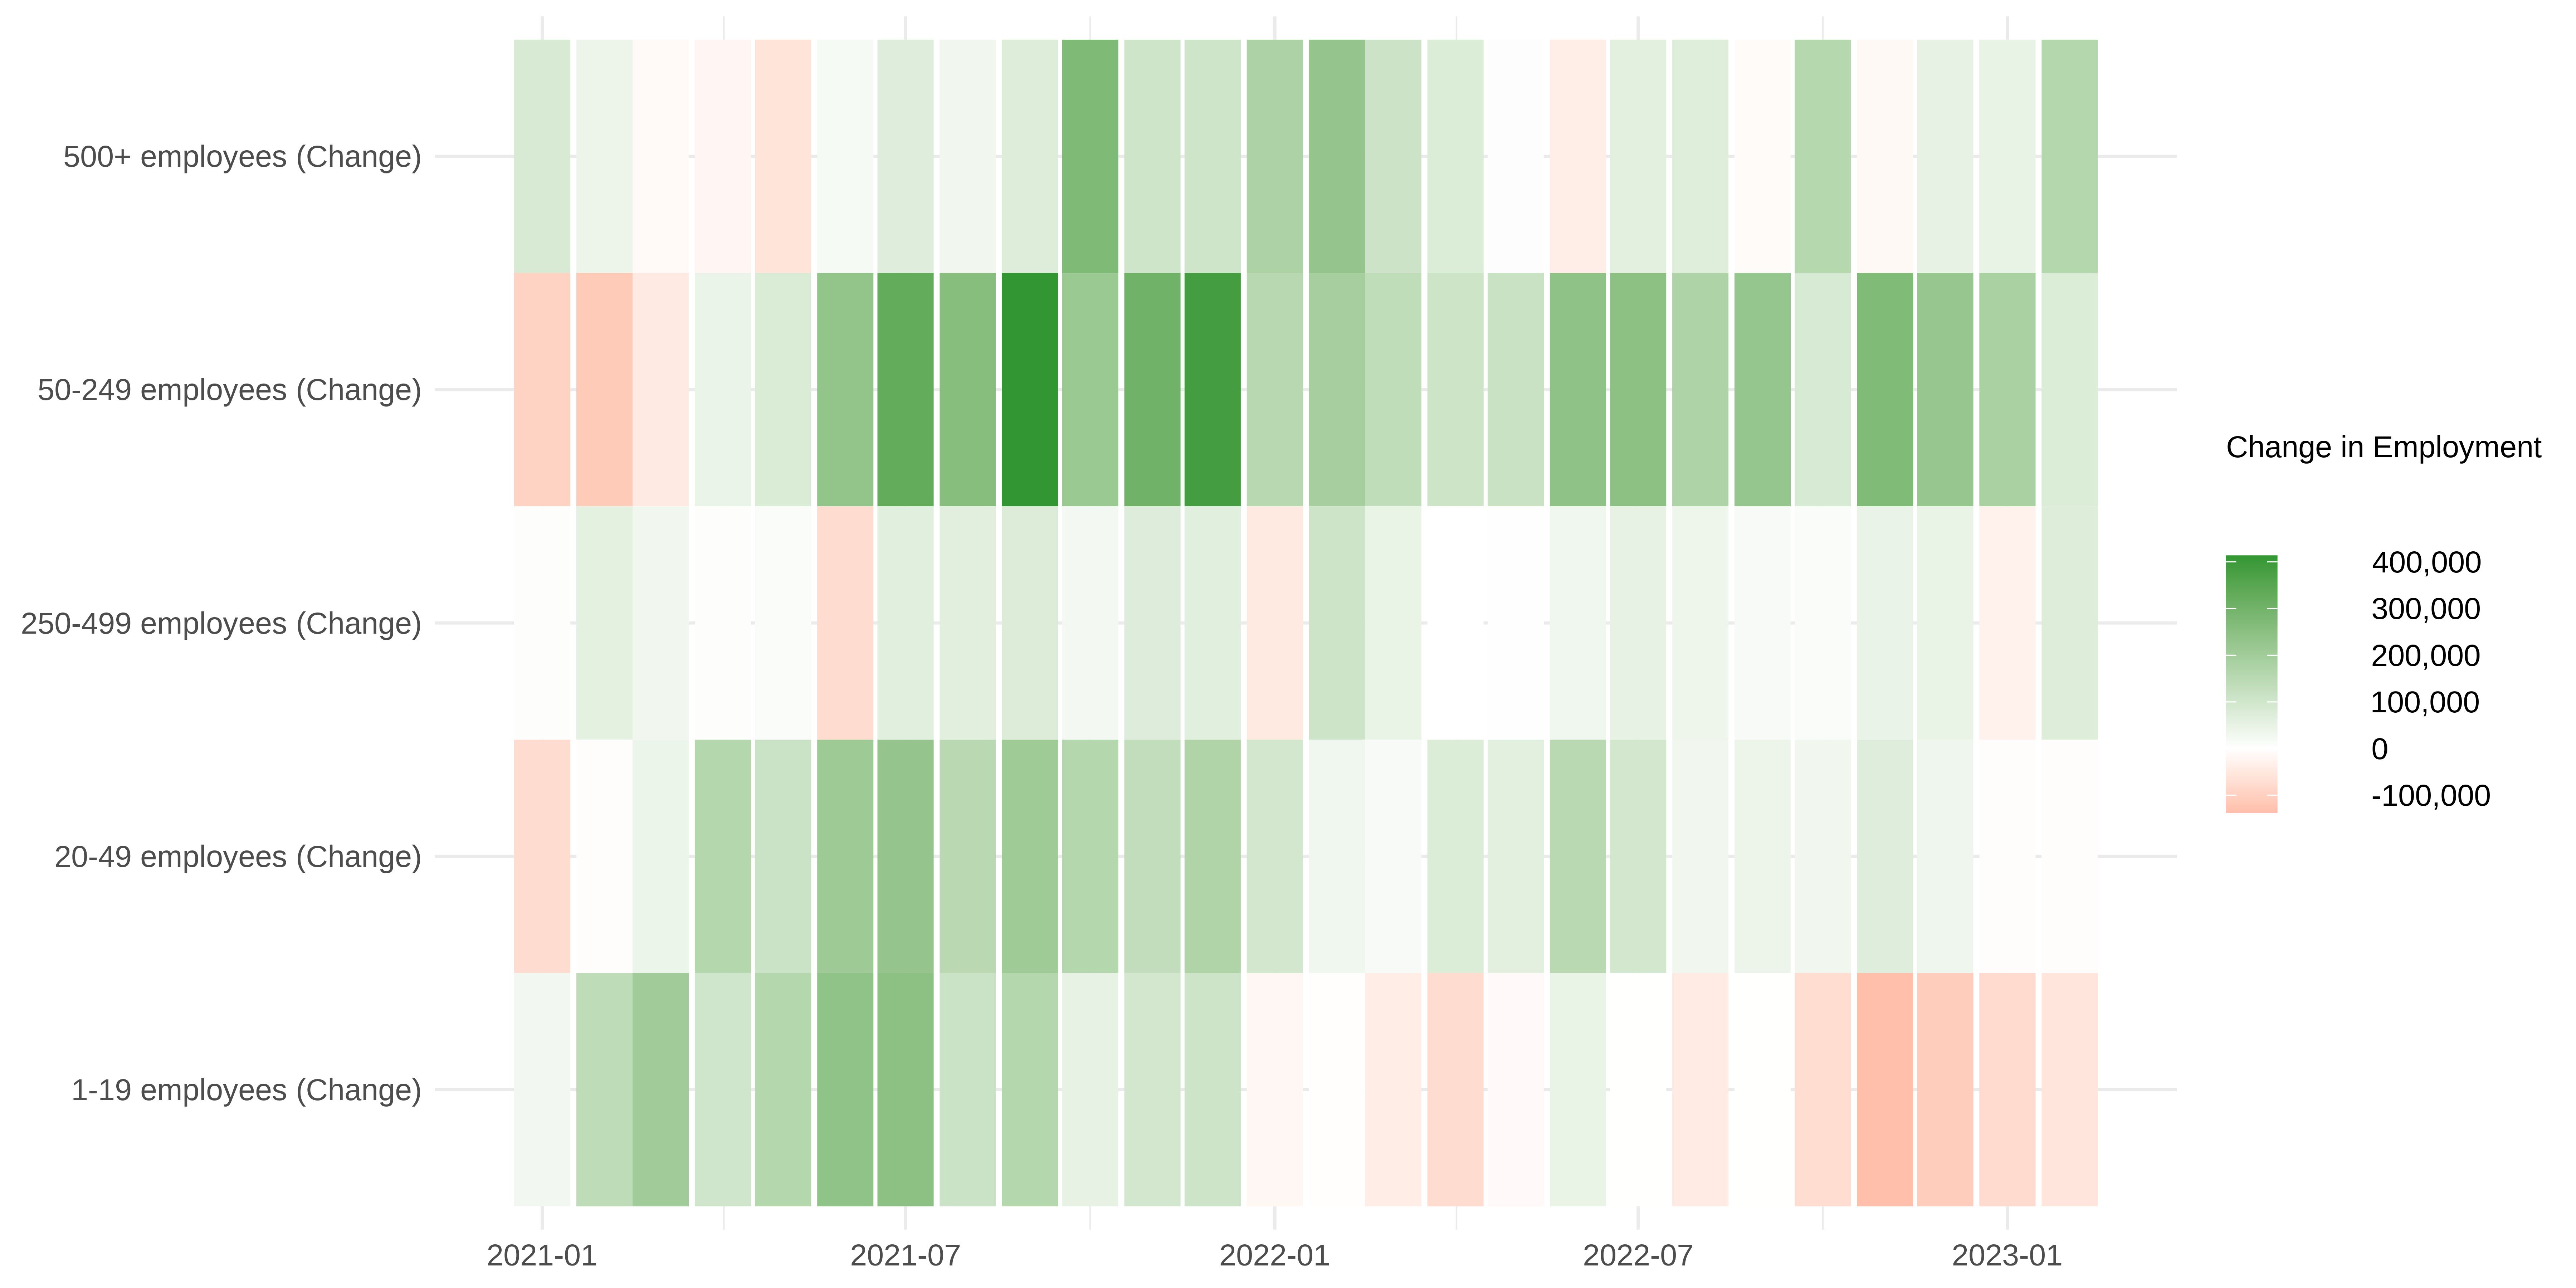
This has been the theme in private employment going back to the start of 2022. Since then, businesses with 50-249 employees have seen the largest growth (~2.3 million jobs added), while those with 1-19 employees have consistently reduced employment over the past 12 periods of data (-577,000 jobs lost).
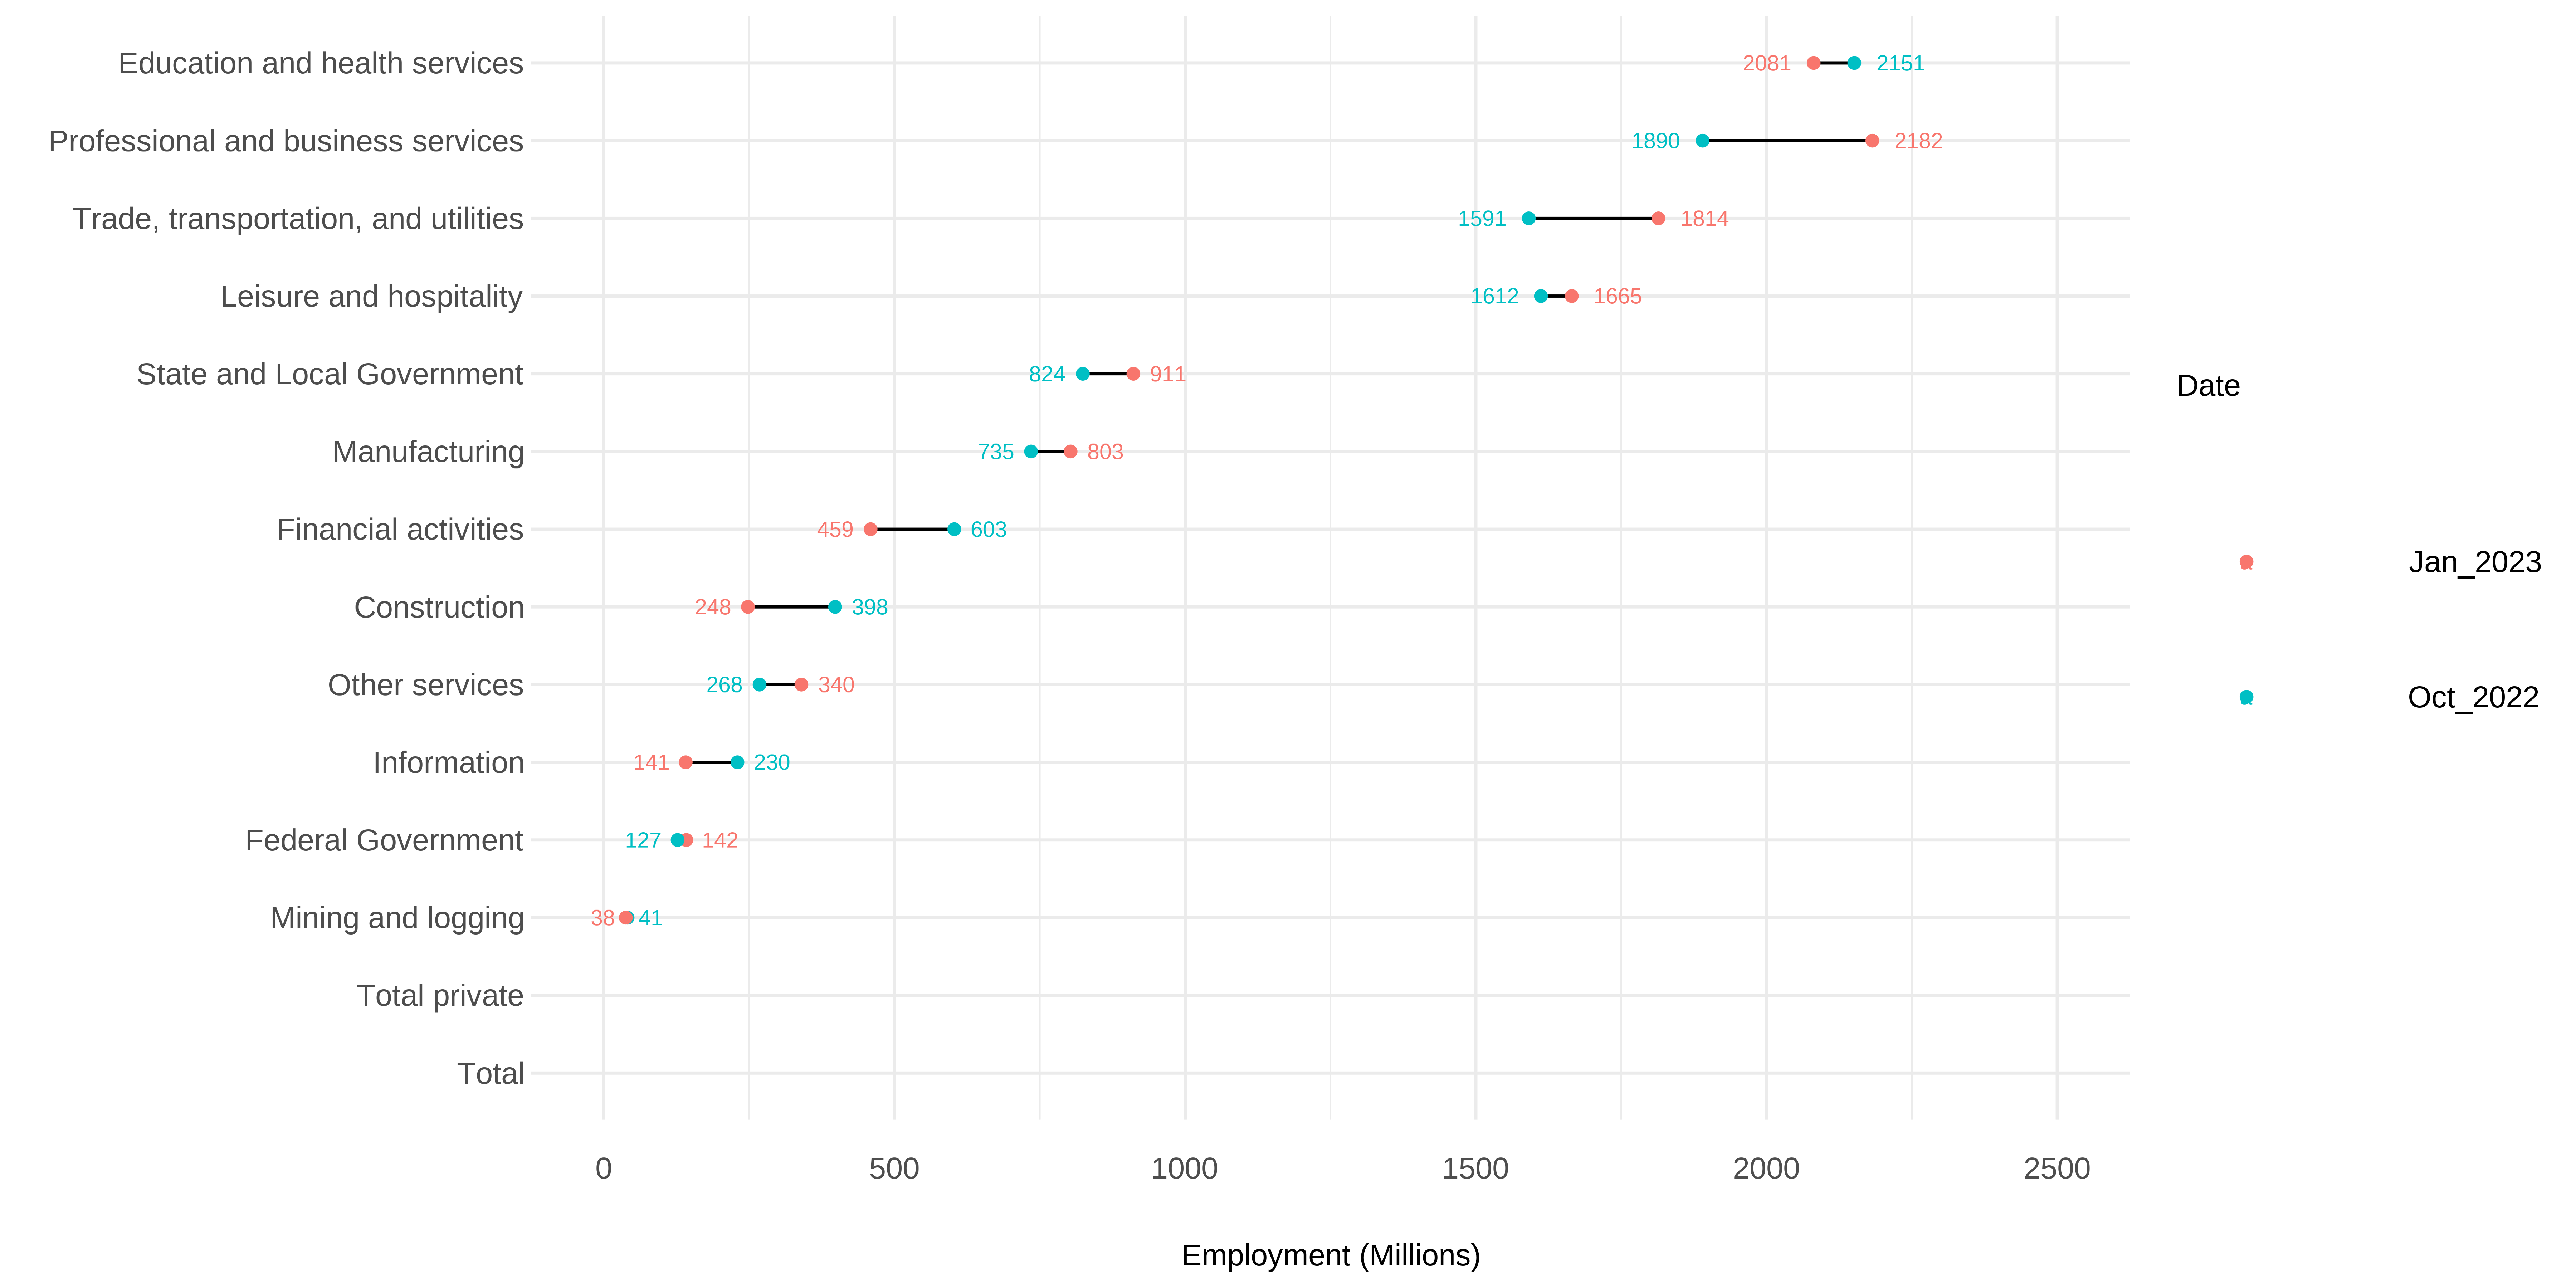
Next, let’s look at the JOLTS report from last Wednesday. Here, we saw the number of job openings decrease in January, as reported by the BLS. Though the data here lags the ADP Report by about a month, similar themes emerged as job openings in construction (-240,000) and finance + insurance (-100,000) contributed to the decline in overall openings (-410,000). Some increases were observed in areas like services (+95,000) and trade, transportation, and utilities (+51,000). In general, these declines were observed primarily in the West and Midwest.
Looking at total separations, quits declined to 2.5%, down from 2.6% the month prior, while layoffs and discharges were relatively stable at 1.1%. The decline in quits was primarily driven by Professional and business services, which fell from 719,000 in December to 498,000 in January. Similarly, layoffs and discharges increased by +191,000 in January to 1.7 million, up from ~1.5 million in December. This was again largely due to negative dynamics among professional and business services workers. Some have said these trends are indicative of continued labor market cooling, but outside of professional and business services, shifts have been very slow.
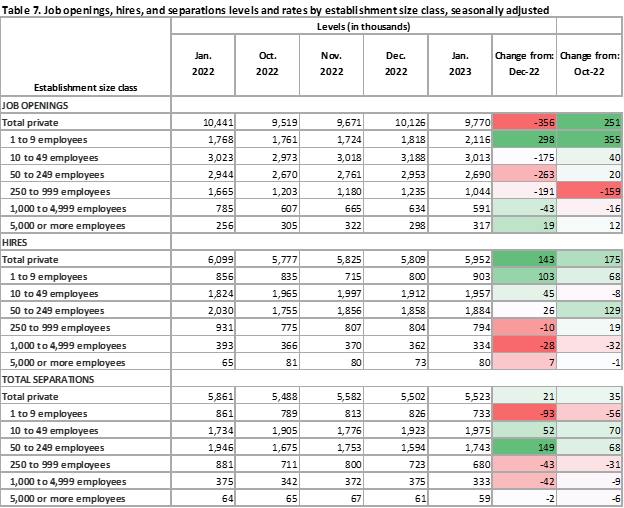
Hiring and separations in the JOLTS report seems to differ vs. some of the trends observed in the ADP Employment Report, though again, there is a difference in the time periods measured. Businesses with 1-9 employees have shown the strongest growth over the past few months, up +68,000 since October 2022. While total private employment is up over that same time frame (+251,000), businesses with 50-249 have driven most of that, with an increase of +129,000. What sticks out from this dataset is the change in job openings over the same period. Businesses with 1-9 employees increased openings by +355,000, while businesses with 50-249 employees were relatively flat. Businesses with 250-999 employees reduced hiring by -159,000. This will be a trend worth monitoring.
As mentioned at the beginning, the release of the Employment Situation for February 2023 showed an increase in the unemployment rate, as more people entered the labor force. Here, the data shows a bit of a mixed story. For those looking for signs of labor market cooling, we see some examples of softening in areas like average hourly wages, hours worked, and the overall unemployment rate. That said, we still see moderate growth, with little sign of an increase in the rate of cooling on the horizon. Leisure and hospitality led the increase in employment, adding +105,000 jobs in February, along with Food services, which added +70,000 jobs, and retail trade, which rose +50,000.
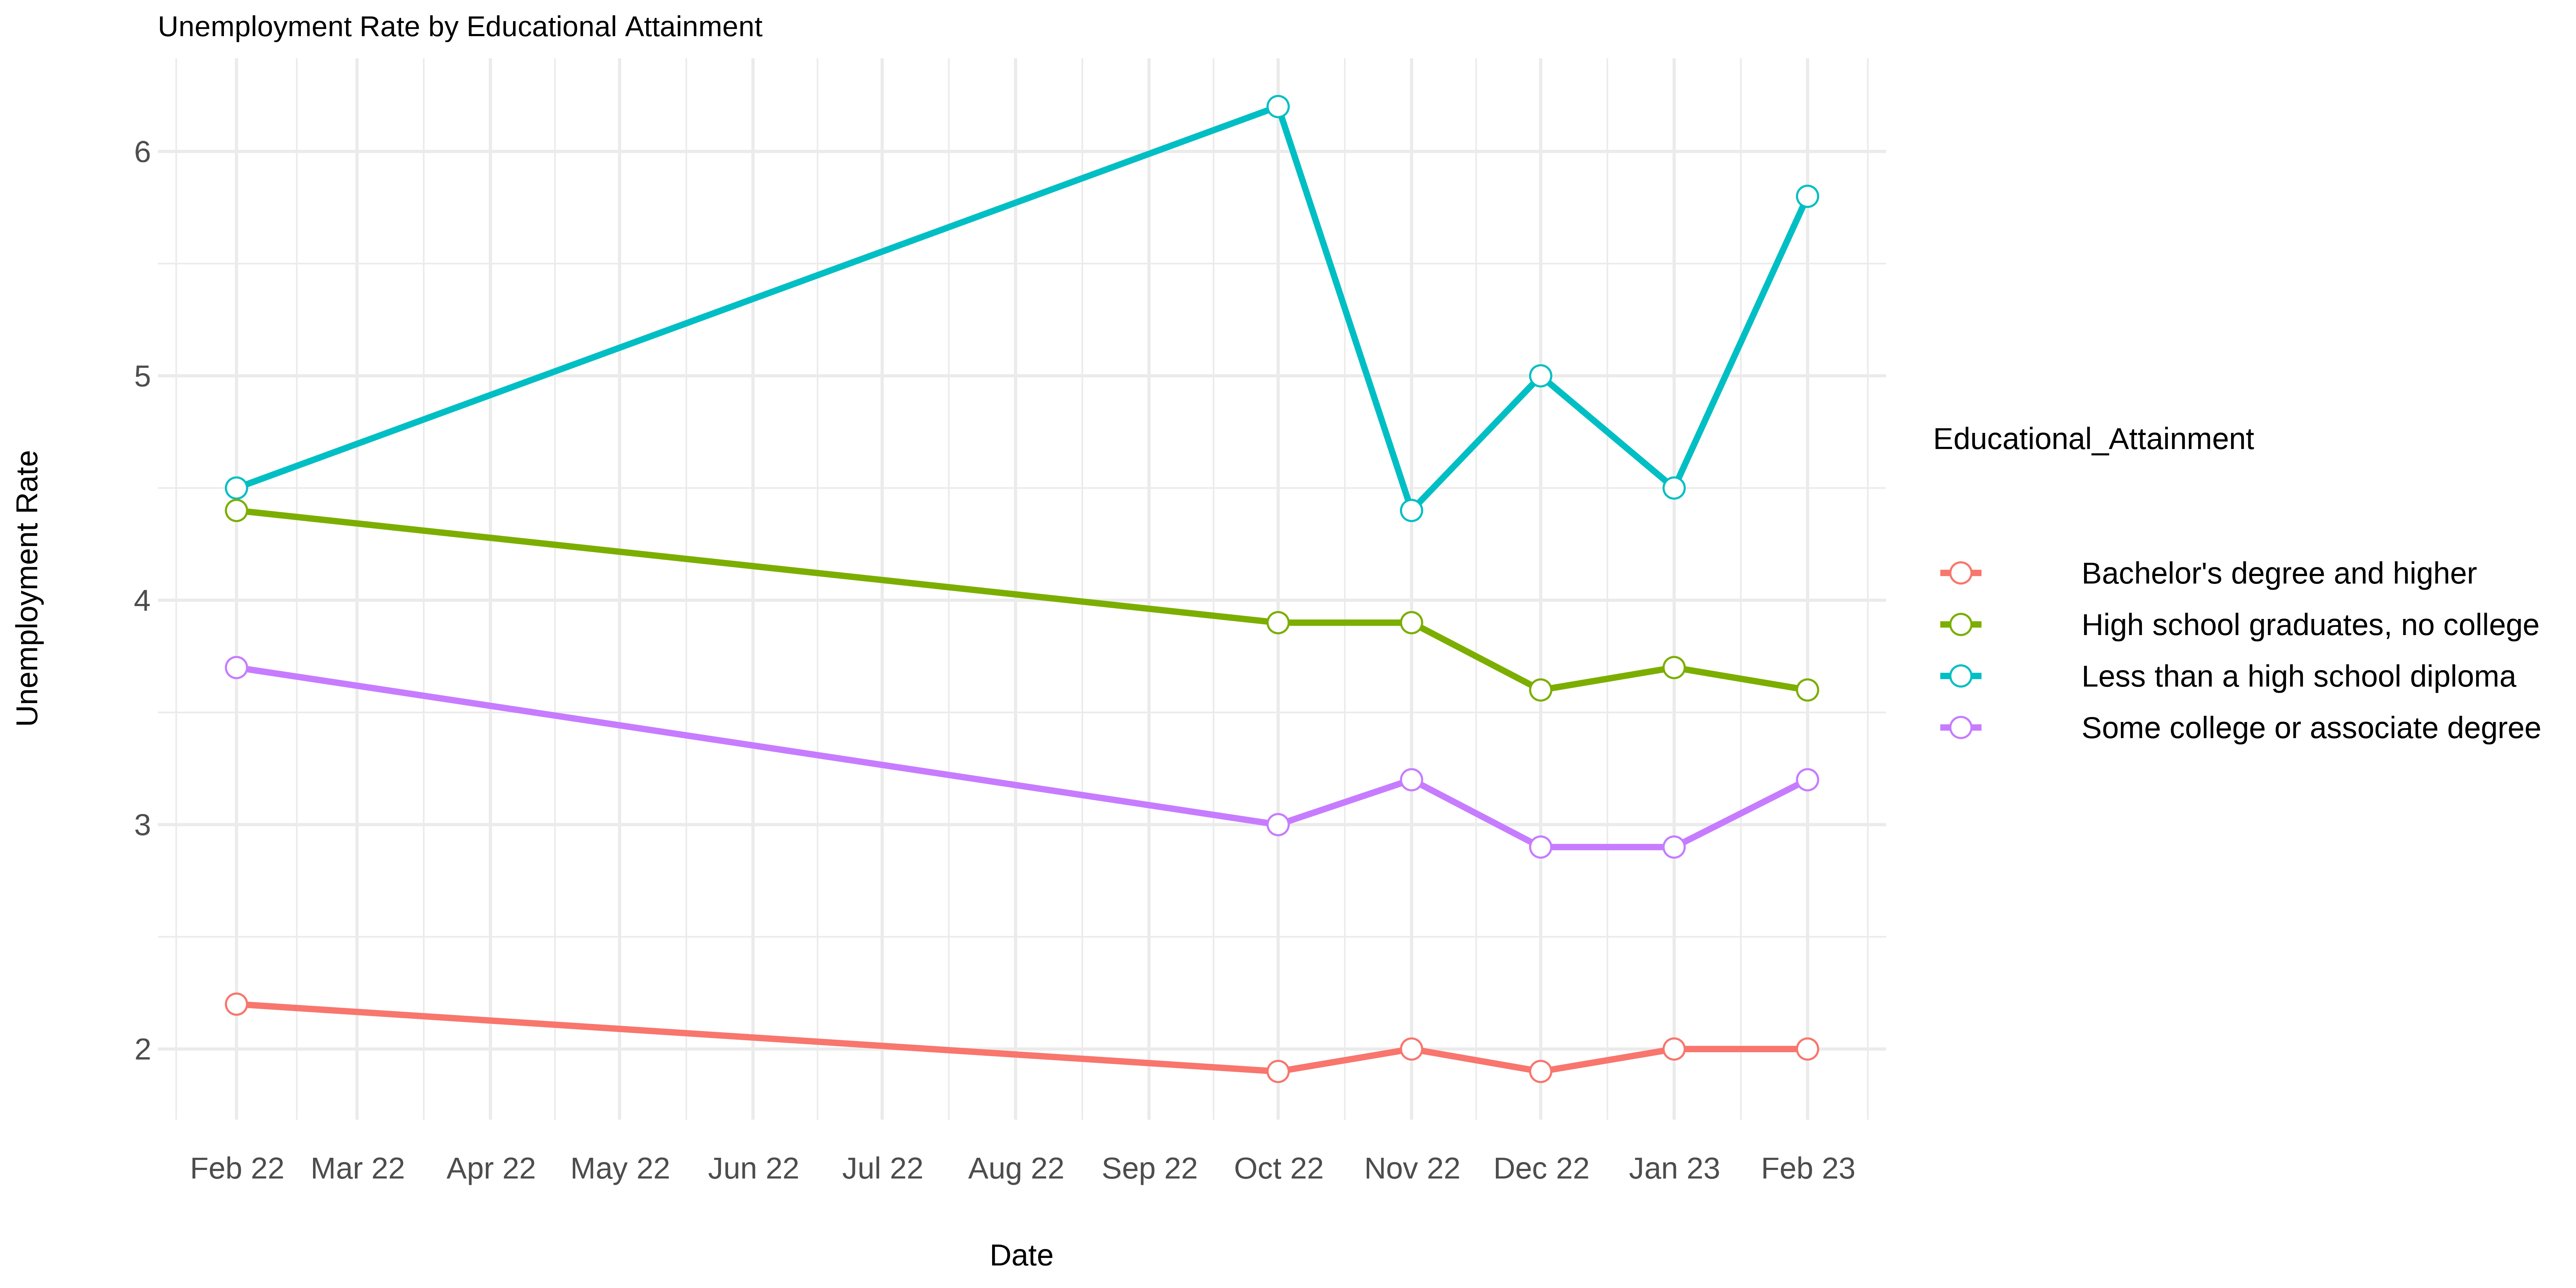
While it’s difficult to draw strong conclusions about this report, there are still some interesting themes in the data. First, the unemployment rate has differed among different ages and levels of educational attainment. Since February 2022, the unemployment rate for those with less than a high school diploma, a group that admittedly only makes up ~6% of the total labor force, has significantly increased from 4.5% in January to 5.8% in February. Meanwhile, the unemployment rate has stayed relatively stagnant for high school graduates without a degree and those with a bachelor’s degree or higher, though it did increase from 2.9 to 3.2% for those with some college or associate degree.
 Differences emerge if we look specifically at age as well. Since February of 2022, unemployment has remained steady for most age cohorts except for those aged 35 to 44 years old, which has seen a decrease in the unemployment rate from 3.3% to 2.6%, and 55 years and over, which has seen a decline in the unemployment rate from 2.9% to 2.5%. We’ve even seen some interesting movements since just last month.
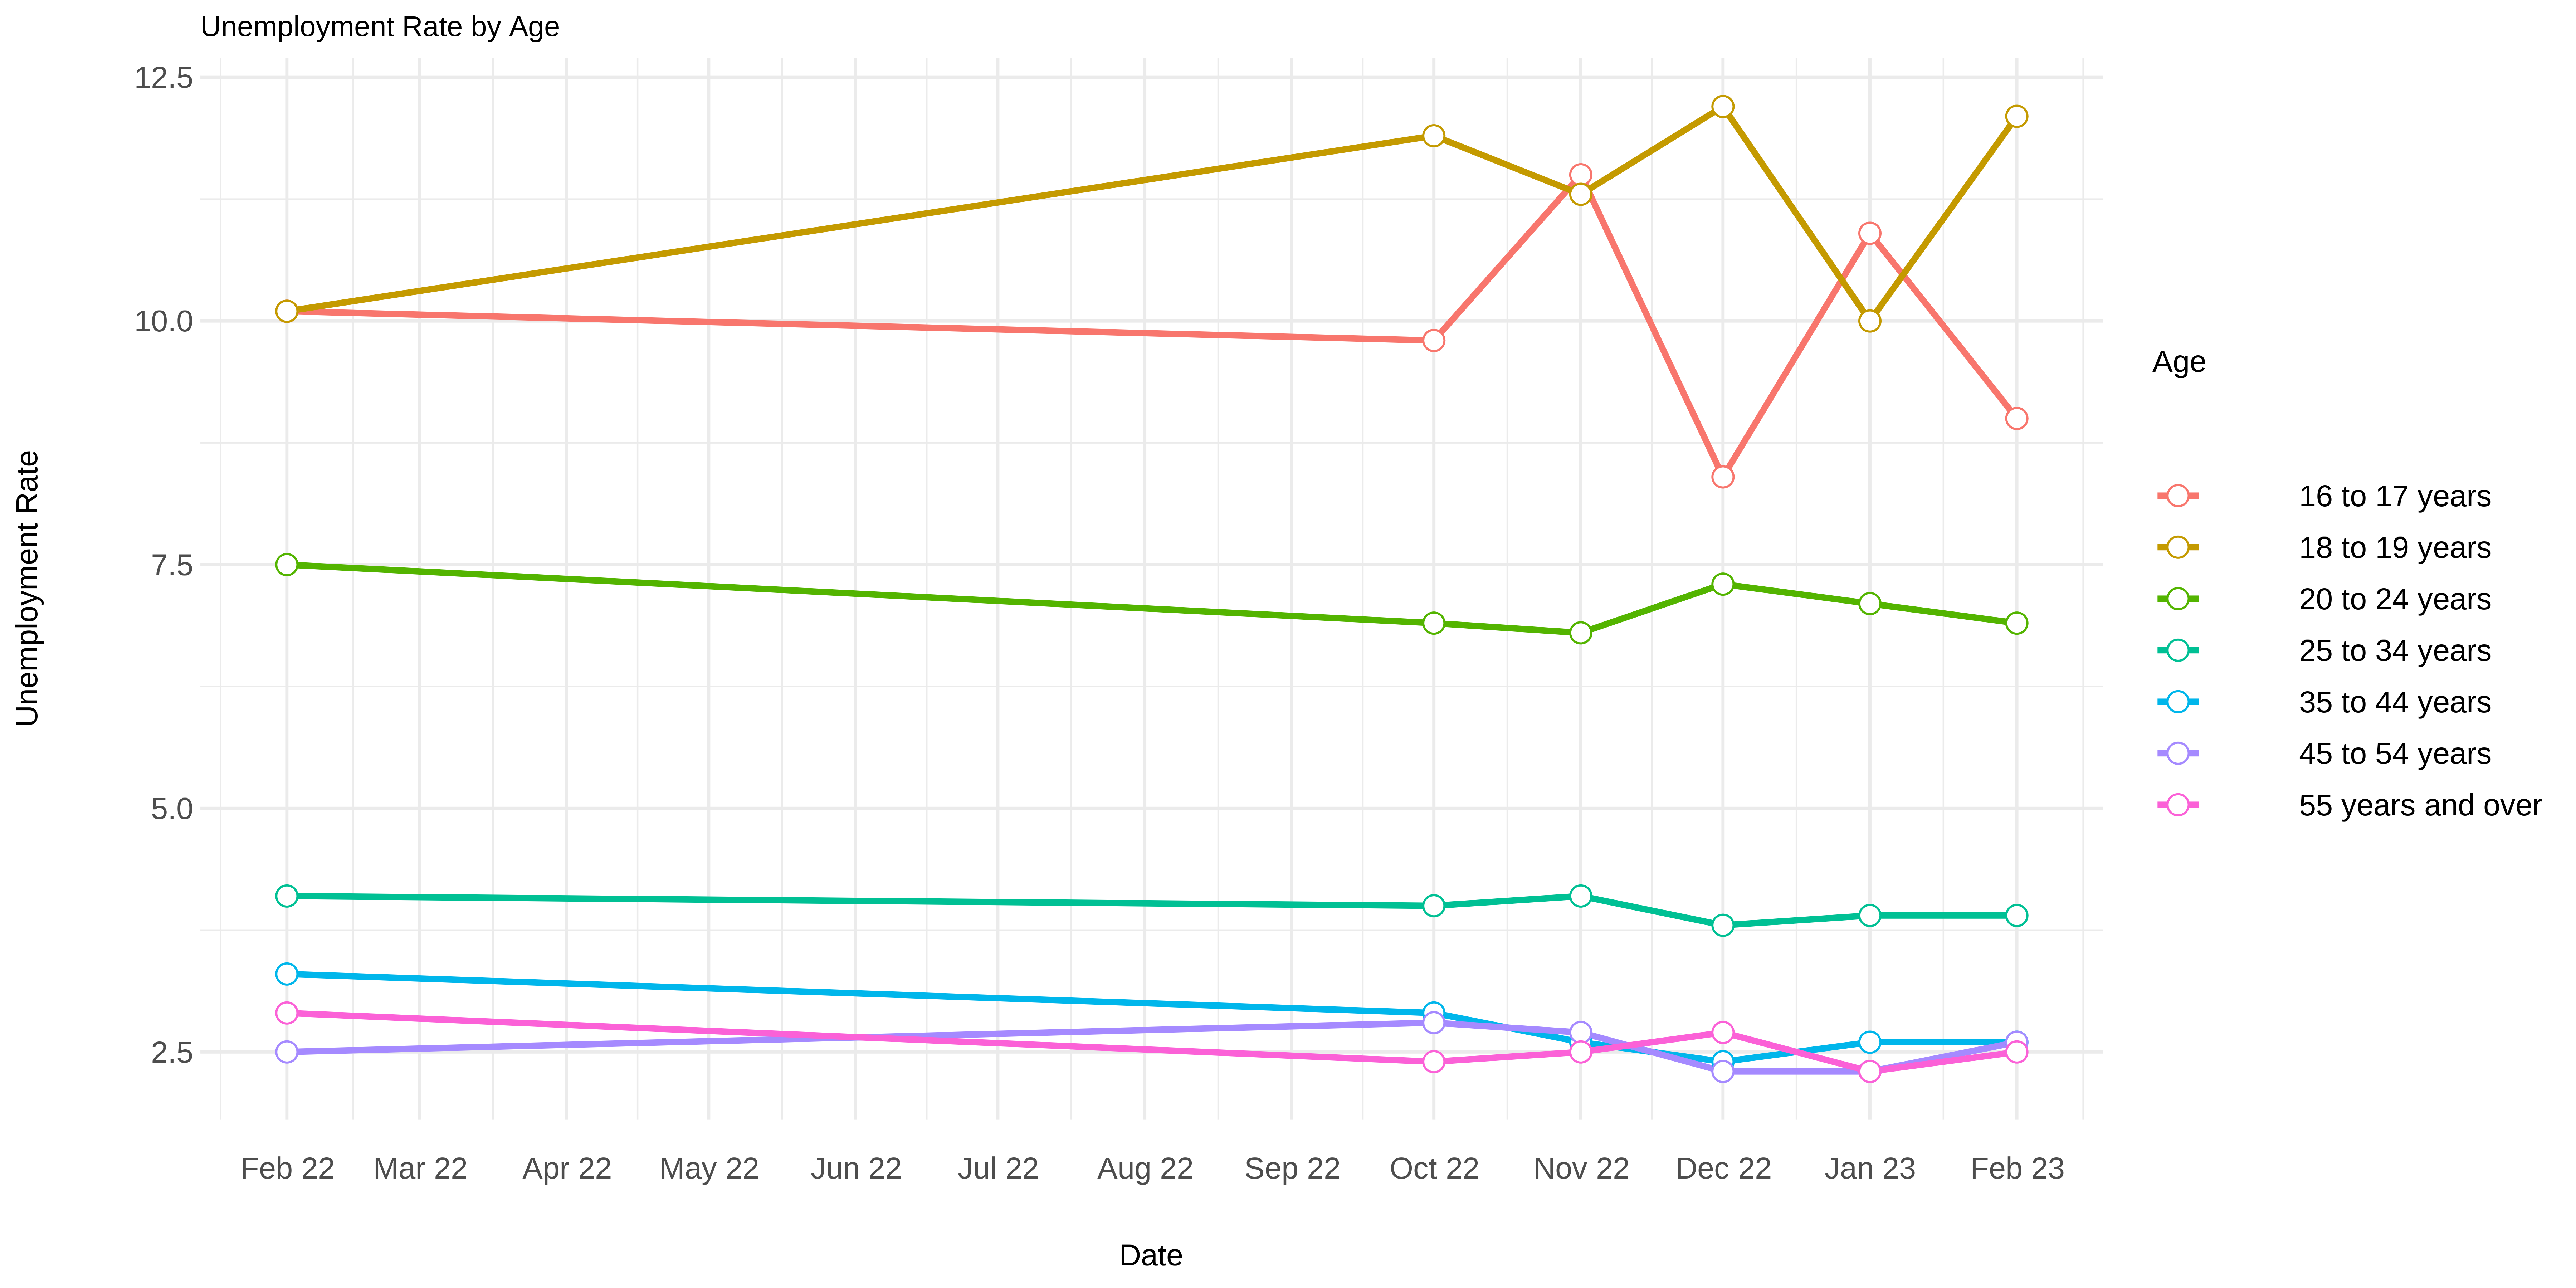
The unemployment rate for those aged 16 to 17 years old has declined from 10.9% to 9.0%, while it climbed to 12.1% from 10.0% for those aged 18 to 19 years old. This is likely driven by some movements in the labor force participation rate, which saw a significant decline for the former cohort, and a significant rise for the latter. That said, trends have been steady overall for most of the prime age working population.
How do these results square with other miscellaneous sources?
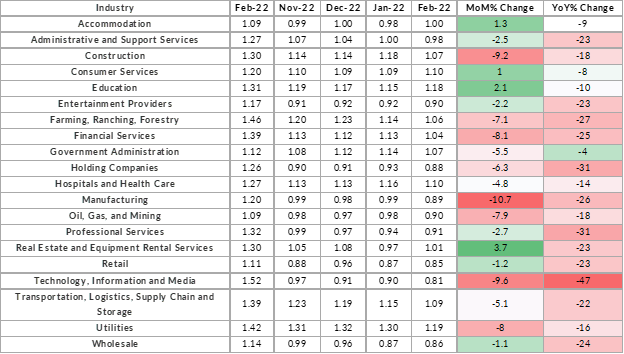
It’s mixed! On March 6th, LinkedIn released its Workforce Report for March 2023, which outlined some interesting trends. In general, the report showed substantial declines in hiring (-6.5%), which was the largest seen since April 2020. This marked the 10th consecutive month of declines, bringing the overall Y-Y hiring decline to -27.9%. Industries like Real Estate (+4%), Education (+2%), and Accommodation (+1%) showed the strongest month-to-month increases, while Manufacturing (-10%), Technology, Information, and Media (-10%), and Construction (-9%) showed the largest declines. The LinkedIn hiring rate looks at the number of hires divided by LinkedIn membership. While it may not necessarily be predictive, it still provides another helpful data point for employment. Most industries have declined since last year, though Tech (-47), Professional Services (-31), and Holding Companies (-31) lead the charge.
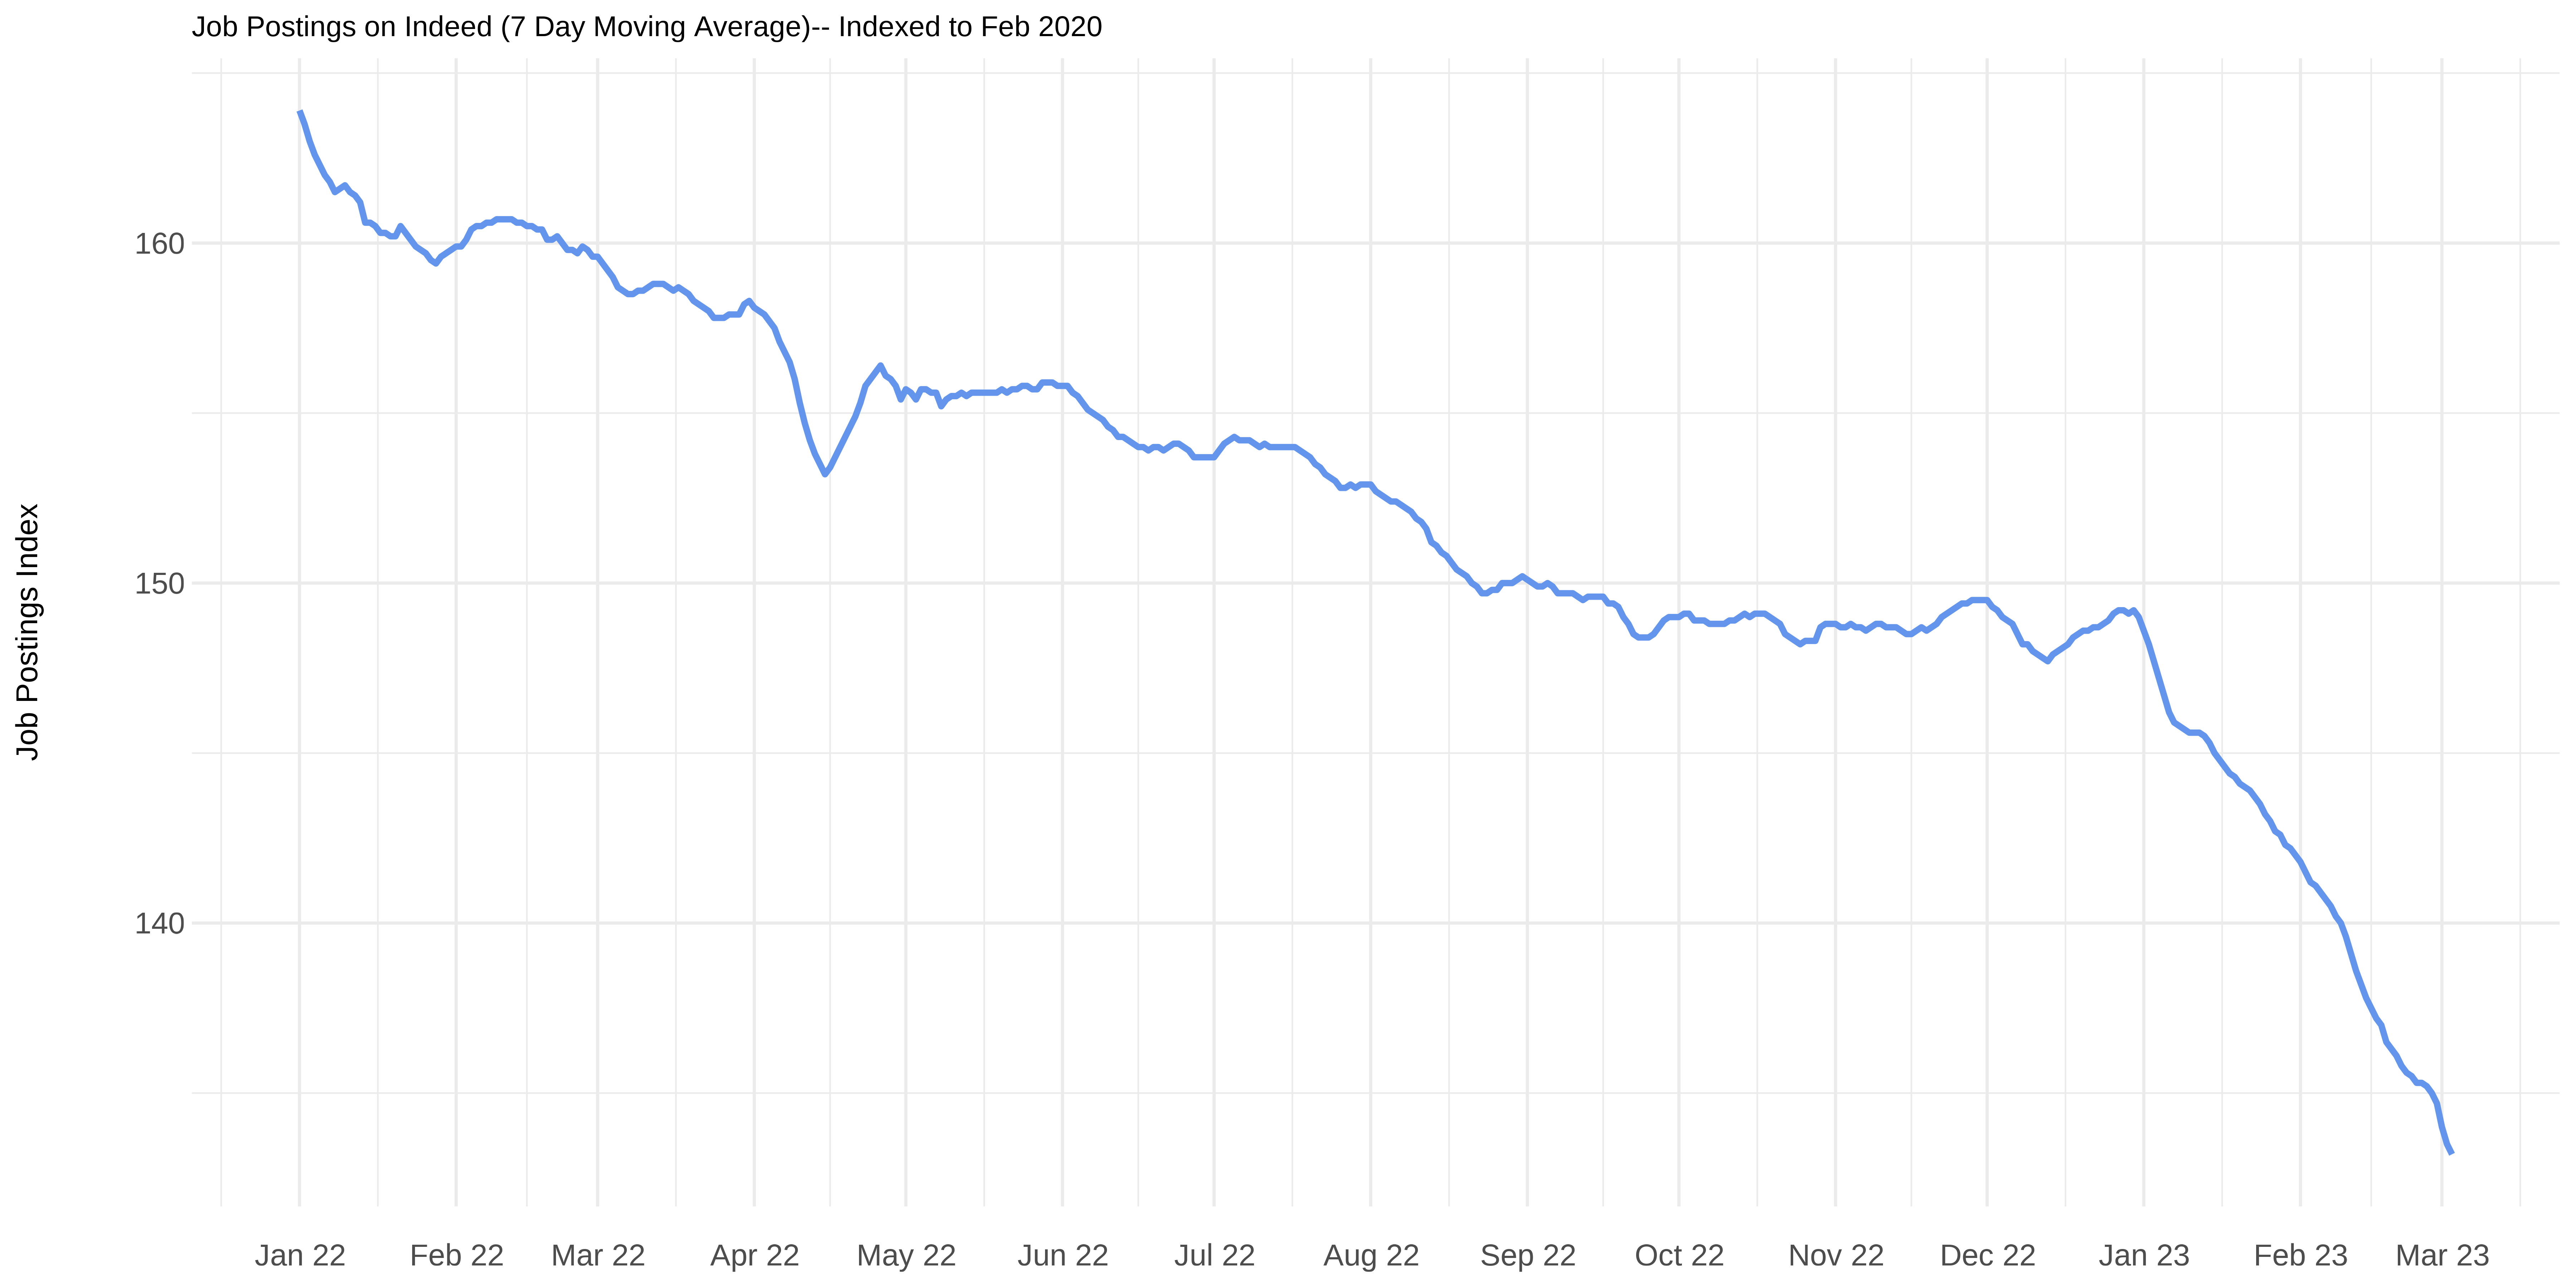
Indeed also tries to monitor employment opportunities through its ‘Job Postings Index’. The index is set to 100 for February 2020 and uses a 7-day moving average to monitor employment opportunities. This data shows a significant decline over the past few months.
Summary
We have conflicting data from various sources, but overall, the labor market seems resilient with some underlying cracks below the surface. The Fed seems to be chipping away at employment to bring inflation down, but the process so far has been slow. If I had to make a prediction, I think we will continue to see the Fed raise rates to ~5.5-6% by the end of the year. There are whispers of coming layoffs among larger companies, particularly in industries like tech and consulting, so my expectation is an unemployment rate around 4.5-5% by the end of the year, with uneven impacts across different age and educational cohorts.